the goal of this little project is to visualise actual wind direction and strength collected from weather stations.
weather stations
In the first step we need to find location of weather stations in our region. In my case I’m interested in wind in NSW and I can get location of all weather stations from a government link:
http://www.bom.gov.au/climate/data/lists_by_element/alphaNSW_283.txt
The first problem here is that the data is formatted for humans and not for computers so we need to parse it. The easiest way to do so is by using pandas library.
import pandas as pd
path = "weather_stations.txt"

with open(path, newline='') as f:
    stations = pd.read_fwf(f, colspecs='infer', header=0)
The beauty of this solution is that we can let pandas infer the formatting of the data for us and parse the file.
Pandas(Index=0, Site=68241, Name='ALBION PARK (SHELLHARBOUR AIRPORT)', Lat=-34.5639, Lon=150.7924, Start='Apr 2011', End='Apr 2025', Years=13.9, _8=97, Obs=1416.1, AWS='Y')
Pandas(Index=1, Site=72160, Name='ALBURY AIRPORT AWS', Lat=-36.069, Lon=146.9509, Start='Sep 2008', End='Apr 2025', Years=16.5, _8=98, Obs=1388.4, AWS='Y')
Pandas(Index=2, Site=56238, Name='ARMIDALE AIRPORT AWS', Lat=-30.5273, Lon=151.6158, Start='Oct 2010', End='Apr 2025', Years=14.4, _8=97, Obs=1429.1, AWS='Y')
Pandas(Index=3, Site=67108, Name='BADGERYS CREEK AWS', Lat=-33.8969, Lon=150.7281, Start='Dec 1998', End='Apr 2025', Years=26.3, _8=97, Obs=1381.9, AWS='Y')
Pandas(Index=4, Site=58198, Name='BALLINA AIRPORT AWS', Lat=-28.8353, Lon=153.5585, Start='May 2010', End='Apr 2025', Years=14.8, _8=98, Obs=1429.7, AWS='Y')
for any visualisation we need to convert gps coordinates into Cartesian plane to create a flat image. Lets prepare the weather stations data for further processing and store it in a file as this data is not going to change.
import pyproj
import json

source_crs_epsg = 4326 # WGS 84 (lat/lon) - Assuming standard GPS input
target_crs_epsg = 32756 # WGS 84 / UTM zone 56S - For Sydney

source_crs = pyproj.CRS.from_epsg(source_crs_epsg)
target_crs = pyproj.CRS.from_epsg(target_crs_epsg)

transformer = pyproj.Transformer.from_crs(source_crs, target_crs, always_xy=True)

def stationToXY(data):
    lat = data[3]
    lon = data[4]
    x, y = transformer.transform(lon, lat) # different order
    return {'name': data[2], 'lat': lat, 'lon':lon, 'x':x, 'y':y}


stations_data = []
for station in stations.itertuples():
    stations_data.append(stationToXY(station))

with open('stations.json', 'w') as f:
    json.dump(stations_data, f, indent=4)
now we have all the weather stations and their positions in a computer friendly format that we can easily draw. here are all weather stations in NSW (without two offshore ones)
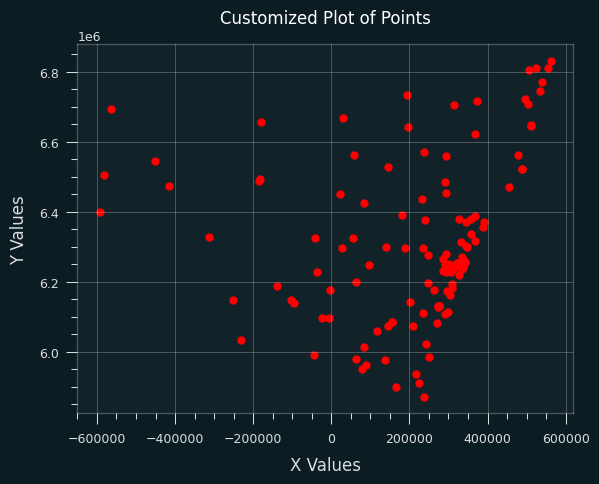
import matplotlib.pyplot as plt
from qbstyles import mpl_style
mpl_style(dark=True)

with open(r"stations.json") as f:
    stations = json.load(f)

x_coords = []
y_coords = []

for s in stations:
    x_coords.append(s['x'])
    y_coords.append(s['y'])

plt.scatter(
    x_coords,
    y_coords,
    color='red',
    marker='.',
    s=100
)

plt.title("Customized Plot of Points")
plt.xlabel("X Values")
plt.ylabel("Y Values")
plt.grid(True)
plt.show()
Wind data
next we need to read the wind data from the stations. since this is just an exercise and I do not want to pay to have access to the API, the next best solution is to scrape the data from a website.
http://www.bom.gov.au/nsw/observations/nswall.shtml
In this case pandas is extremely helpful as it can detect and parse tables in html
import requests
import pandas as pd
from io import StringIO

url = 'http://www.bom.gov.au/nsw/observations/nswall.shtml'

# --- Define a realistic User-Agent ---
headers = {
    'User-Agent': 'Mozilla/5.0 (Windows NT 10.0; Win64; x64) AppleWebKit/537.36 (KHTML, like Gecko) Chrome/91.0.4472.124 Safari/537.36'
}

response = requests.get(url, headers=headers, timeout=10)
response.raise_for_status() # Raise an exception for bad status codes (like 403, 404, 500)

html_content = StringIO(response.text)
list_of_dataframes = pd.read_html(html_content) # No need for header=0 here unless needed for parsing

if list_of_dataframes:
    print(f"Successfully found {len(list_of_dataframes)} table(s)")
the data is in multiple tables but with pandas we can easily merge them together
data = pd.concat(list_of_dataframes, axis=0)we can also make the data easier to access. first we can ditch the annoying multiIndex header and then we can promote the column containing weather station names to be used as row index.
data = data.droplevel(0, axis=1)
data = data.set_index('Unnamed: 0_level_1')
merging data sources
at this stage we have the data pulled from two data sources and we need to combine it. Unfortunately the names of the weather stations are fairly different in both cases. For instance even very simple cases do not match:
BELLAMBI AWS
bellambi
obviously we know this is the same station but the code is not that smart. chatGPT API could easily help here but we can also use standard old school methods of fuzzy string matching
from rapidfuzz import process,fuzz

choices = [c.lower() for c in wind.index]
for name in stations.index:
    match = process.extractOne(name.lower(), choices, scorer=fuzz.partial_ratio)
    print(f"Name: {name}, Match: {match}")
rapidfuzz is not great when the matched strings are case sensitive and in this example all strings are converted to lower case. This matches all stations perfectly.
Name: ALBION PARK (SHELLHARBOUR AIRPORT), Match: ('albion park', 100.0, 60)
Name: ALBURY AIRPORT AWS, Match: ('albury', 100.0, 138)
Name: ARMIDALE AIRPORT AWS, Match: ('armidale', 100.0, 30)
Name: BADGERYS CREEK AWS, Match: ('badgerys creek', 100.0, 38)
Name: BALLINA AIRPORT AWS, Match: ('ballina', 100.0, 0)
Name: BANKSTOWN AIRPORT AWS, Match: ('bankstown', 100.0, 39)
def combine(stations, wind):
    """update stations with wind data from the second table"""

    combined = pd.DataFrame()

    choices = [c.lower() for c in wind.index]
    for name in stations.index:
        #find the best match in the wind data, case insensitive
        match = process.extractOne(name.lower(), choices, scorer=fuzz.partial_ratio)

        i = choices.index(match[0]) #get the index of the match
        print(f"Name: {name}, Match: {match}")
        w = wind.iloc[i]

        direction = w['Dir'].to_list()[0] #[1] gust direction
        speed = w['Spd km/h']
        gust = w['Gust km/h']
        date = w['Date/Time EST']
        stations.loc[name, 'dir'] = direction
        stations.loc[name, 'speed'] = speed
        stations.loc[name, 'gust'] = gust
        stations.loc[name, 'date'] = date
        combined = pd.concat([combined, stations.loc[name].to_frame().T], ignore_index=True)

    return stations
visualisation on the web
To make the collected data useful we need to store it. Storing it in json files quickly gets overwhelming as the new data can be collected every 10 minutes. A better way is to store it in the database. We have two types of data in this case: static list of weather stations and their positions and the wind data every 10 minutes. it makes sense to separate them. For that we can make two tables one for the stations that we populate once and another one for the wind data that gets scraped every 10 minutes.
To automate the scraping of the data I use my synology server which can run custom python scripts. With a cron job my script runs every 10 minutes scraping the data and pushing them to a database on my web server.
the front end is, for me, the hardest part of this exercise as I’m not a web developer and I’m not going to describe he mess I made in php/css/javascript to get the website going :-). The result is here:
https://nopixels.net/pg/wind/?preset=stanny
I started by generating images from python that a simple website could play but this solution was slow (many images to download on user end), required a lot of storage and not flexible (impossible to change the look for the historical data).