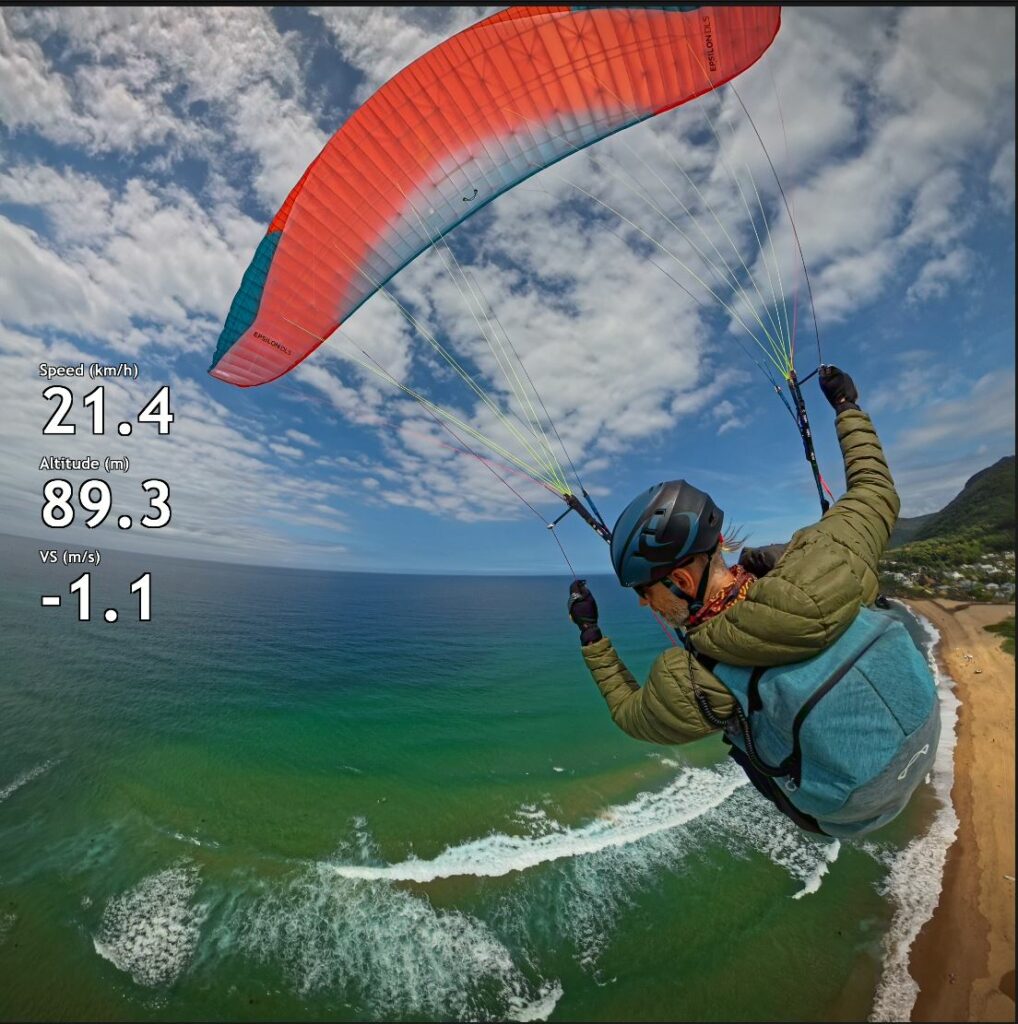
I wanted to add overlays to my videos showing some basic flight statistics. Unfortunately I wasn’t able to find any existing tools to do it, besides some quite pricey ones so I ended tinkering in python. Making the overlays using PIL was trivial but dealing with GPS data proved a bit harder.
Altitude
Lets start with something simple. I want to show vertical speed. The vario/gps records the altitude in meters every second so the math is as simple as it gets:
vs = alt[i] - alt[i-1] #m/s
since every sample is taken once per second the distance travelled is equal to the speed in meters per second. However there is a problem. The altitude is rounded to nearest meter which means the vertical speed is also rounded. This makes it a bit useless as it jumps between -1, 0 and 1.
We need more precision. We also may want to display it more often than once per second on the final video. This means we need to interpolate the data. Below are the raw points (red) showing uninterpolated vertical speed with a green interpolated curve.
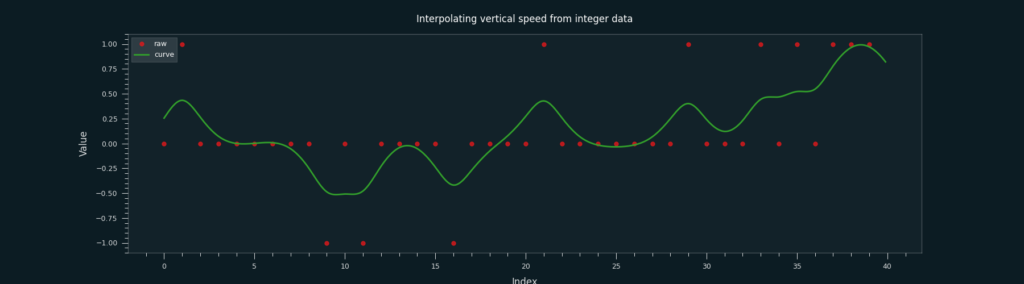
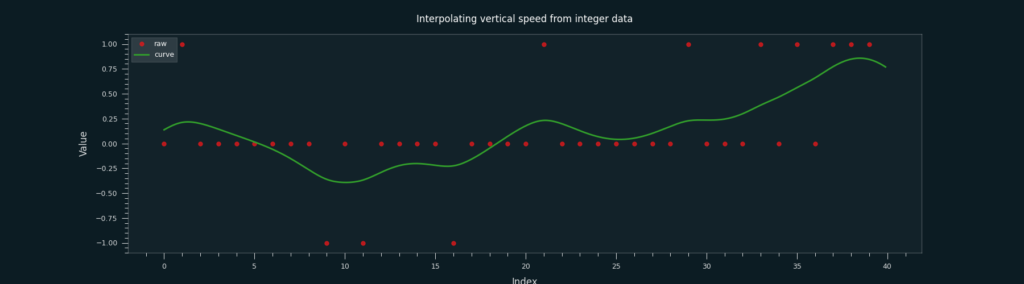
The usual question is how much do we want to smooth the data. if we overdo it we may lose too much information but if we don’t smooth enough we will have a lot of noise.
Here is what the altitude data looks after it is smoothed out from the raw integer data. We could do better here by reducing the number of samples but for the purpose of the overlay this is pretty good already
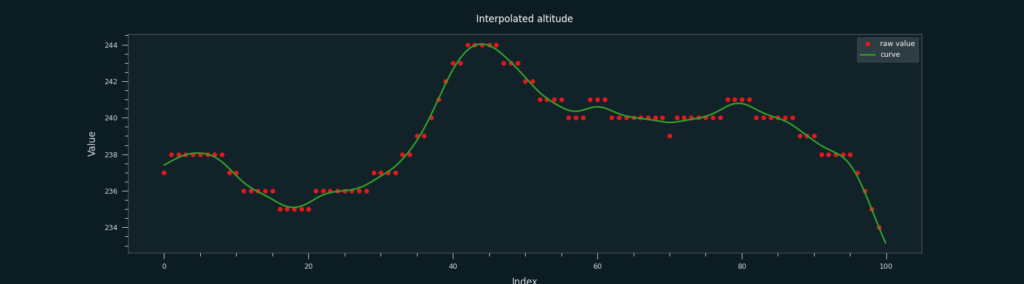
I have experimented with various ways to smooth the altitude data and found out that using make_smoothing_spline was giving me the best results.
from scipy.interpolate import make_smoothing_spline

class Interpolator():
    def __init__(self, data: List, l: float = 5):
        self.data = data
        x = np.arange(len(self.data))
        y = self.data
        self.spl = make_smoothing_spline(x, y, lam=l)

    def get(self, time: float):
        return self.spl(time)

    def __getitem__(self, key):
        return self.get(key)

    def __len__(self):
        return len(self.data)
Speed
next we want to show the speed. This is a bit more involved as we need to calculate travelled distance from latitude and longitude, which again are imprecise with limited precision. Can we use the same interpolation or do we need something more complex? turns out that the same interpolation seems to be ok. I tried Bezier interpolation and it worked well but the results were almost identical to make_smoothing_spline with smaller lambda so to keep the code simple I decided to use the same interpolation.
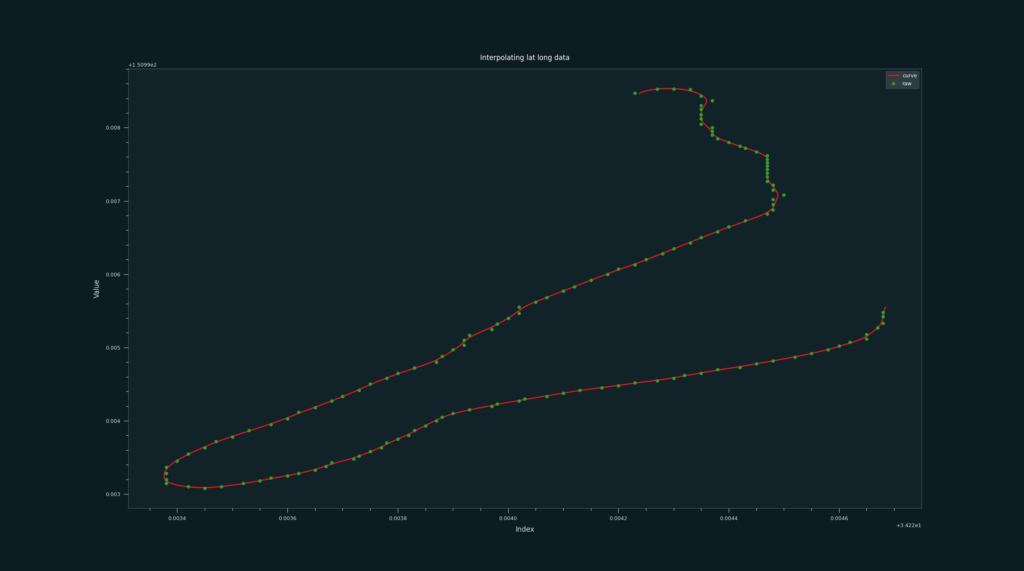
Since the interpolation was the hardest part, and we have it sorted already, the speed calculation is pretty simple. To be precise we can use geopy to calculate the distance correctly but with our imprecise interpolated data we could do calculation on Cartesian plane using simple trigonometry.
from geopy.distance import geodesic

distance = geodesic((self.latitude[i], self.longitude[i]), (self.latitude[i - 1], self.longitude[i - 1])).meters
since we have one sample per second the speed in m/s equals distance the same as in the vertical speed case at the beginning.
Reading the IGC data
We now have a solid method for preparing data for visualization. Several pip packages can help with data retrieval, all of which seem to parse the files correctly. I ultimately chose igc_reader, though without any particular reason. My simple class integrates an interpolator for the data.
from igc_reader import igc_reader
class IgcReader():
    def __init__(self):
        self._igc_reader = igc_reader.read_igc
        self._raw_data = None
        self._track = None
        self.altitude = None

    def load(self, path):
        self._raw_data = self._igc_reader.from_file(path)
        self._track = self._raw_data.track

        self.altitude = Interpolator(self._track.gps_alt, 5)
        self.latitude = Interpolator(self._track.latitude, 0.5)
        self.longitude = Interpolator(self._track.longitude, 0.5)

    def getLength(self):
        return len(self._track.latitude)

    def getSpeed(self, index):
        distance = geodesic((self.latitude[index], self.longitude[index]), (self.latitude[index - 1], self.longitude[index - 1])).meters
        return distance * 3.6  # km/h

    def getAltitude(self, index):
        return self.altitude[index]

    def getVerticalSpeed(self, index):
        return self.altitude[index] - self.altitude[index - 1]
Result
A command-line tool resulting from this exercise allows direct processing of IGC files into a sequence of PNG files. The current tool has very limited options, as it is tailored to my specific needs. You can find it on my GitLab.
https://github.com/p0las/igcoverlay
igc2overlay.py --igc 250322013012.igc --out c:\temp\test6\ --fps 10
All this to put some useless numbers on videos 🙂
if you find this tool useful please buy me a coffee: